Enjoy access to all of your structures’ behaviors online. It's that simple.

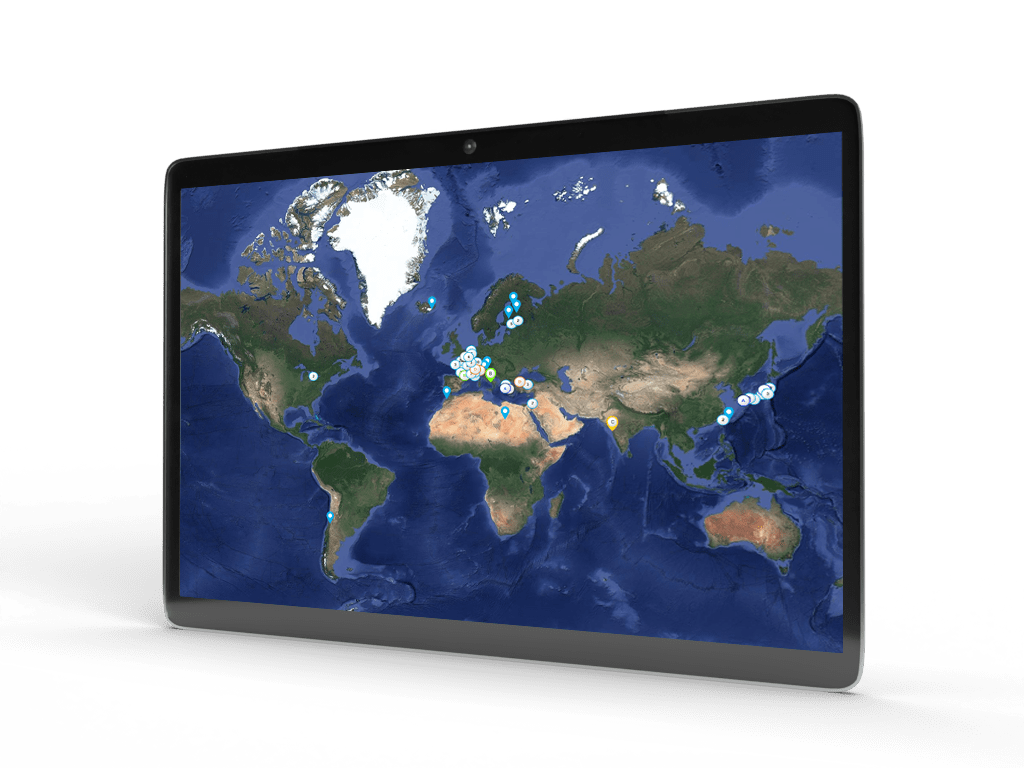
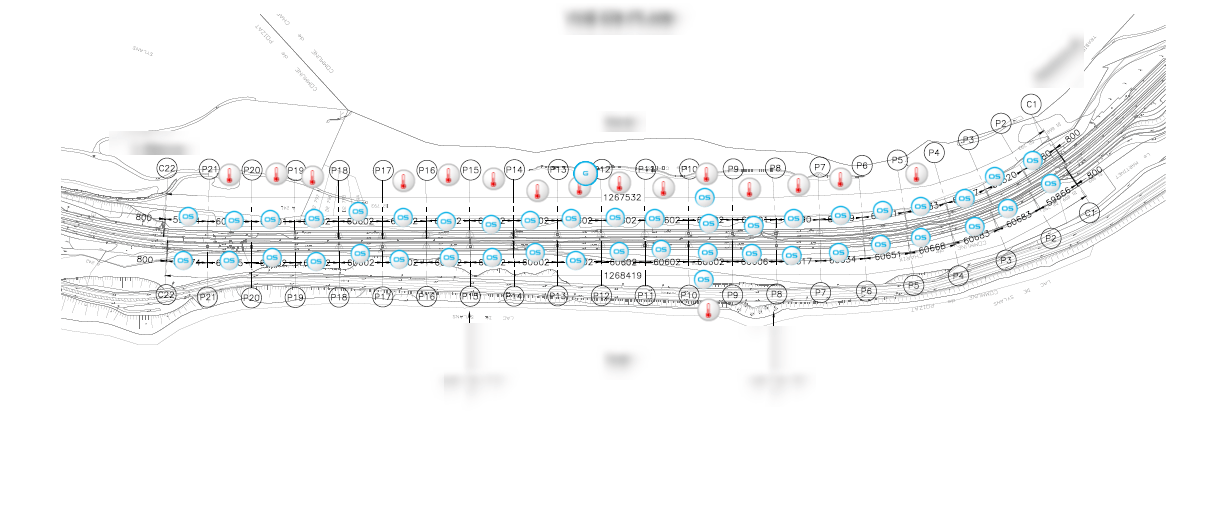
  • Global overview of your facilities
  • Mathematical and statistical analyses
  • Business intelligence
  • Collaboration and dialogue

Verify

  • Verify the state of your structures
  • Check convoys and their impact on your structures
  • Check the load-bearing capacities of your structures
  • Check your structures aging and wear
  • Monitor risky operations in real time

React

  • Receive customized alerts that can help you make the right decisions
  • Receive technical assistance
  • Centralized on-call management with customer interface


Anticipate

  • Plan ahead for potential risks
  • Anticipate future damage
  • Anticipate future behaviors


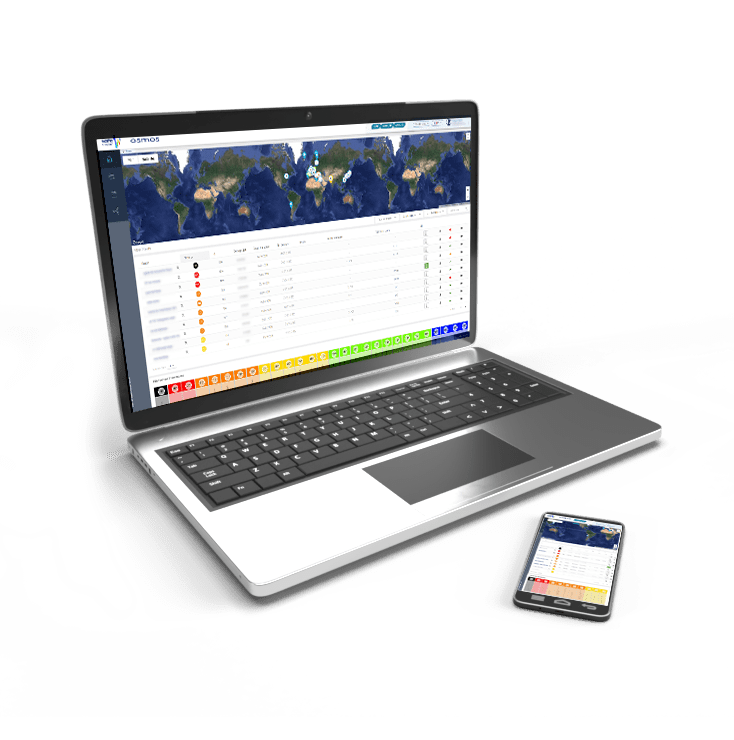
Multi-project management interface

SAFE WorksTM, our dedicated interface, provides an overview of your structures and their general state of health, allowing you to prioritize the necessary actions to be carried out. As a structural asset manager, the SAFE WorksTM collaborative platform is a real help in your decision-making.
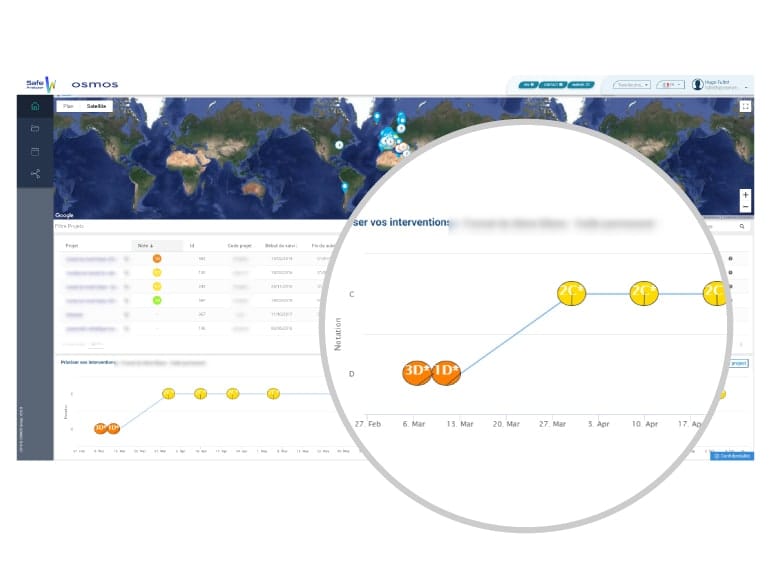
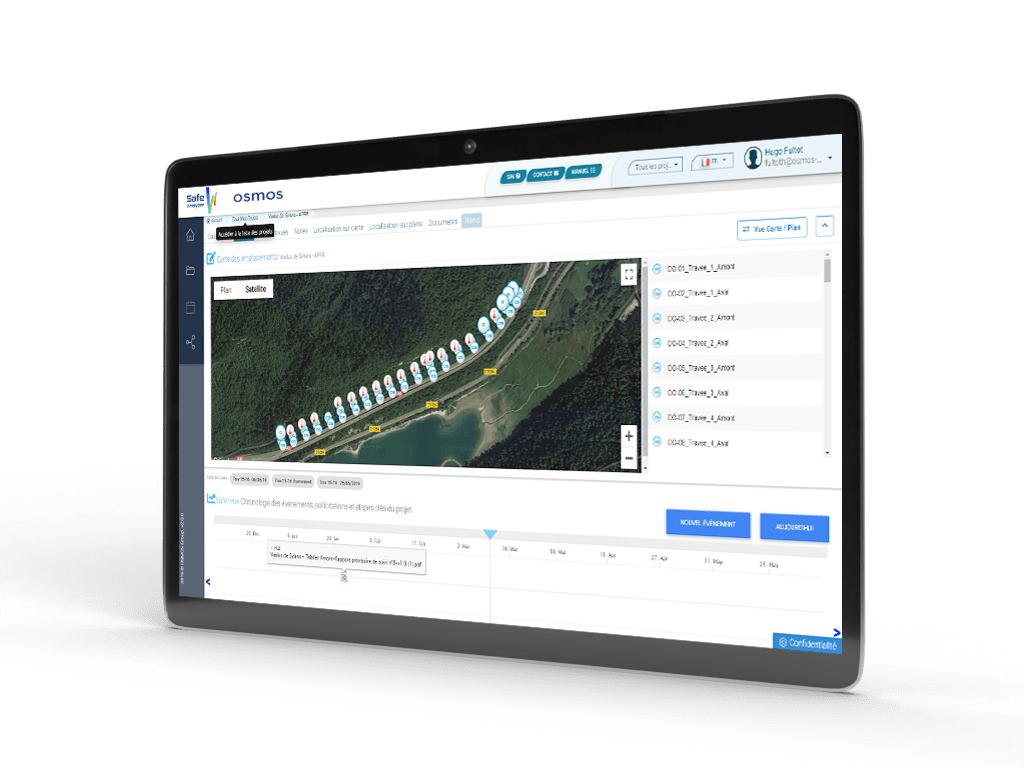
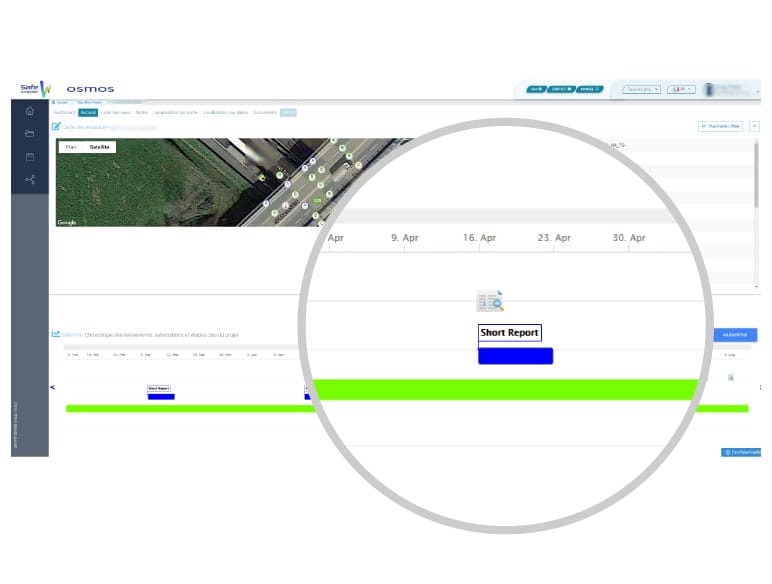
Stability index and notations

  • Quick visualization of the structure's state of health
  • Increased vigilance in certain areas of the structure
  • Relevant indicator based on different time scales
  • Synthetic score for each sensor of the project
  • Synthetic score for the project (the lowest rates given)

Reporting and documents

  • Visualization of the documents provided by OSMOS or by the client
  • Analysis reports
  • Projects events
  • Installation specifications

Project dashboard

Each structure under surveillance has a dedicated page on which the various participants to the project can consult information and details of the project as well as its progress.

Dashboard

  • Preview of the state of health of your structure via your customizable page in the form of blocks and indexes

SAFE Time

  • Overview of the status of a project over time
  • Reporting of events that can have an impact on the state of the structure
  • History of documents provided by OSMOS or by the client
  • Project rating history

Views saving

  • Preconfiguration of data displays
  • Easy access to preconfigured data
  • Multiple configurations saving

Plan management

  • Location of projects
  • Visualization of the location of the sensors on the structure
  • Access to different location modes (map and plan)
  • Direct access to project data from sensor locations
  • Display of the ratings assigned to each sensor

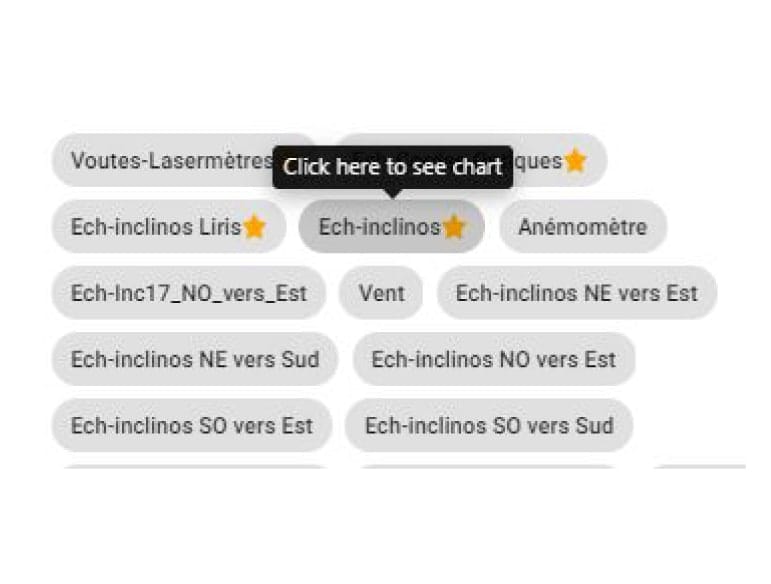
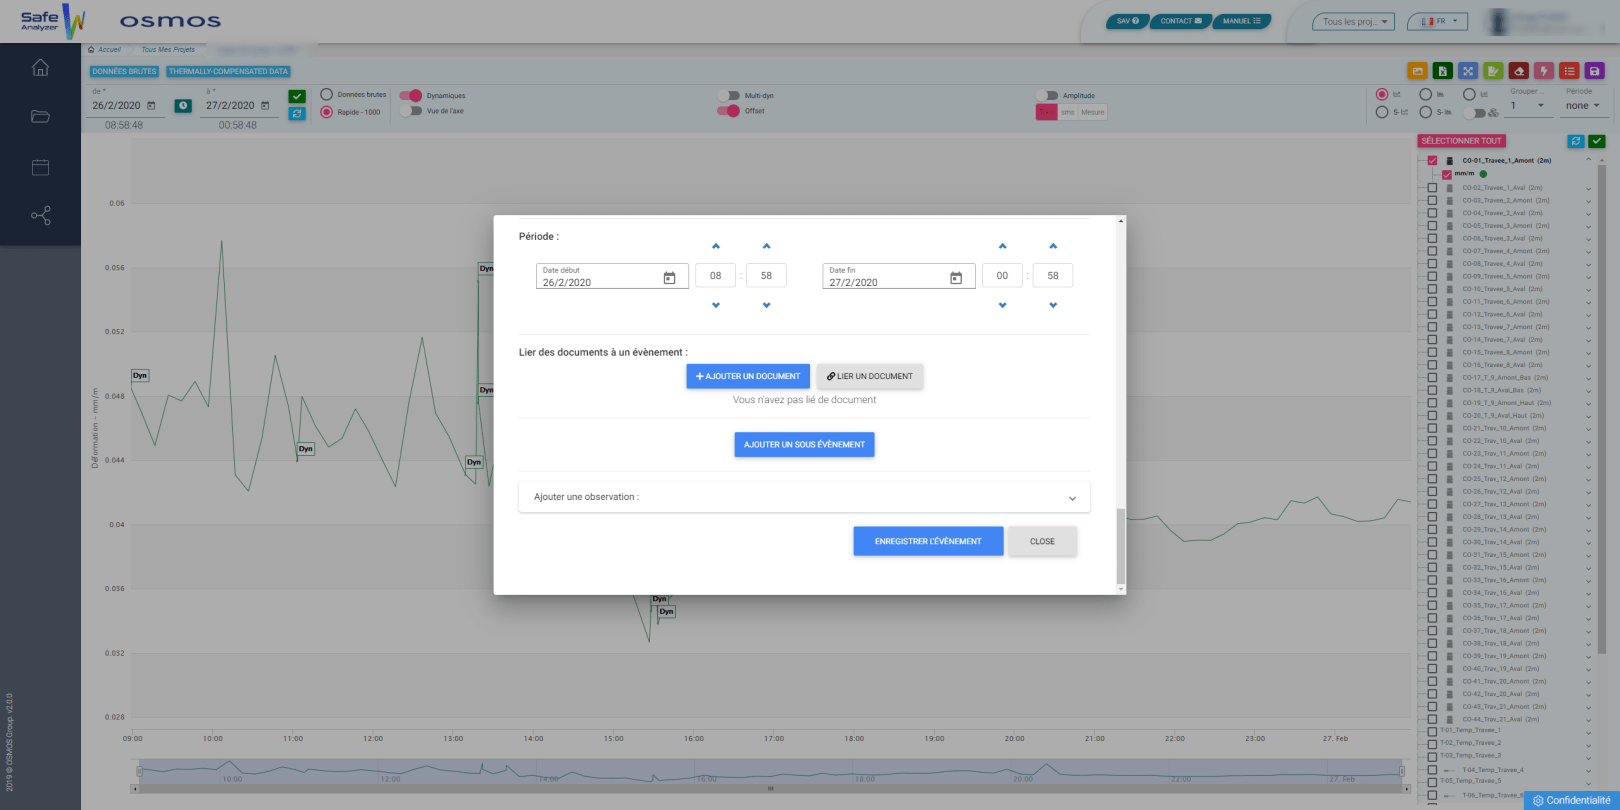
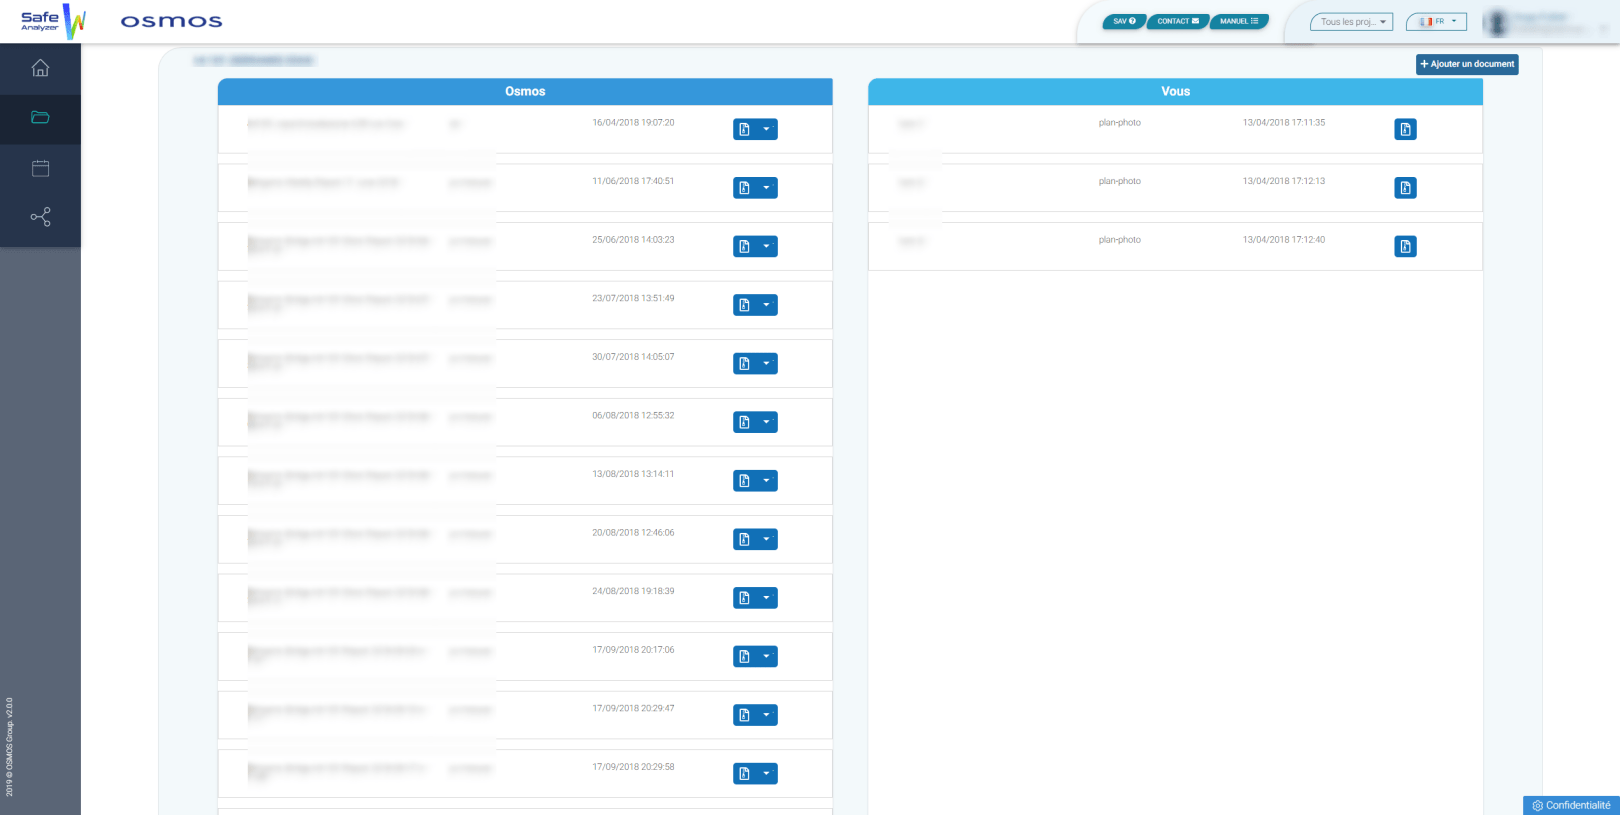
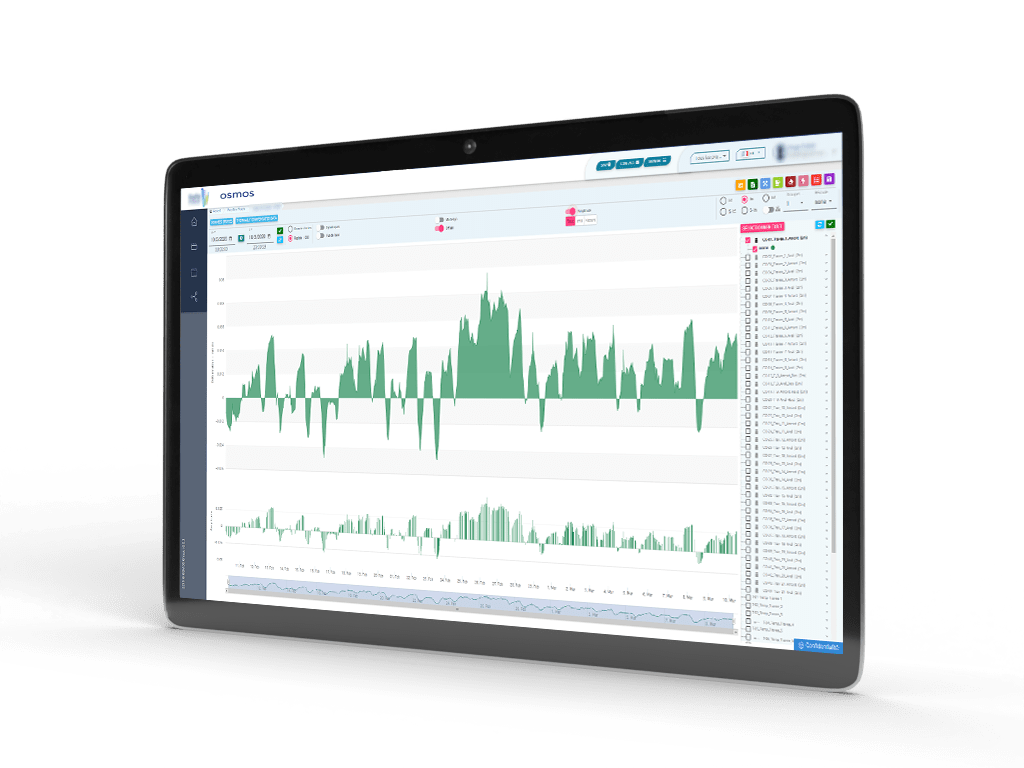
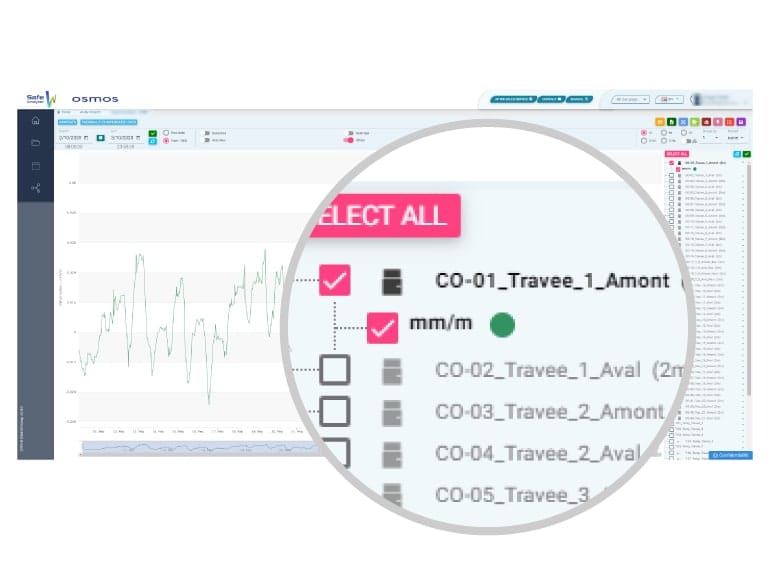
Monitoring data space

On SAFE WorksTM, the data for each project is accessible via the project page. You can consult the monitoring data of your project at any time, make your own display settings and export the graphs (raw data, time range, axis inversion, amplitude, offset setting, dynamic data, etc.).

Multi-sensors management

  • Access to the data of each sensor
  • Display of several sensors simultaneously
  • Comparison of data from several project sensors
  • Multi-dynamic display
  • Event creation from multiple sensors

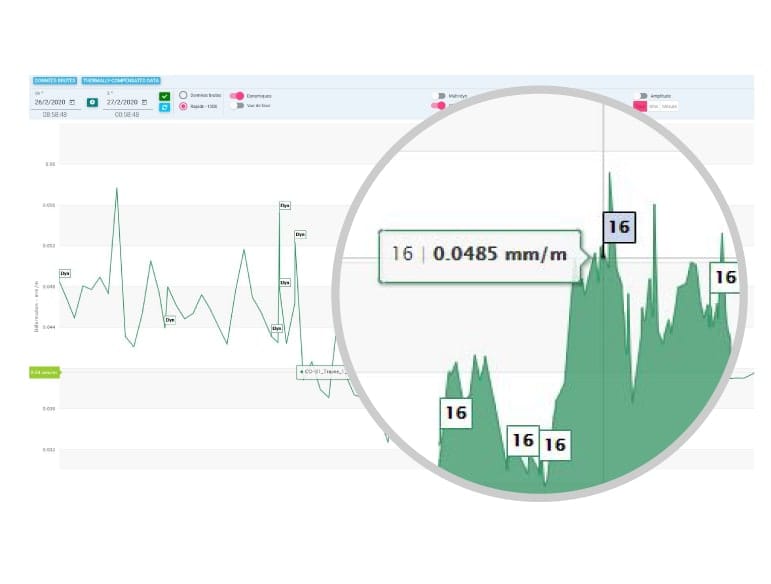
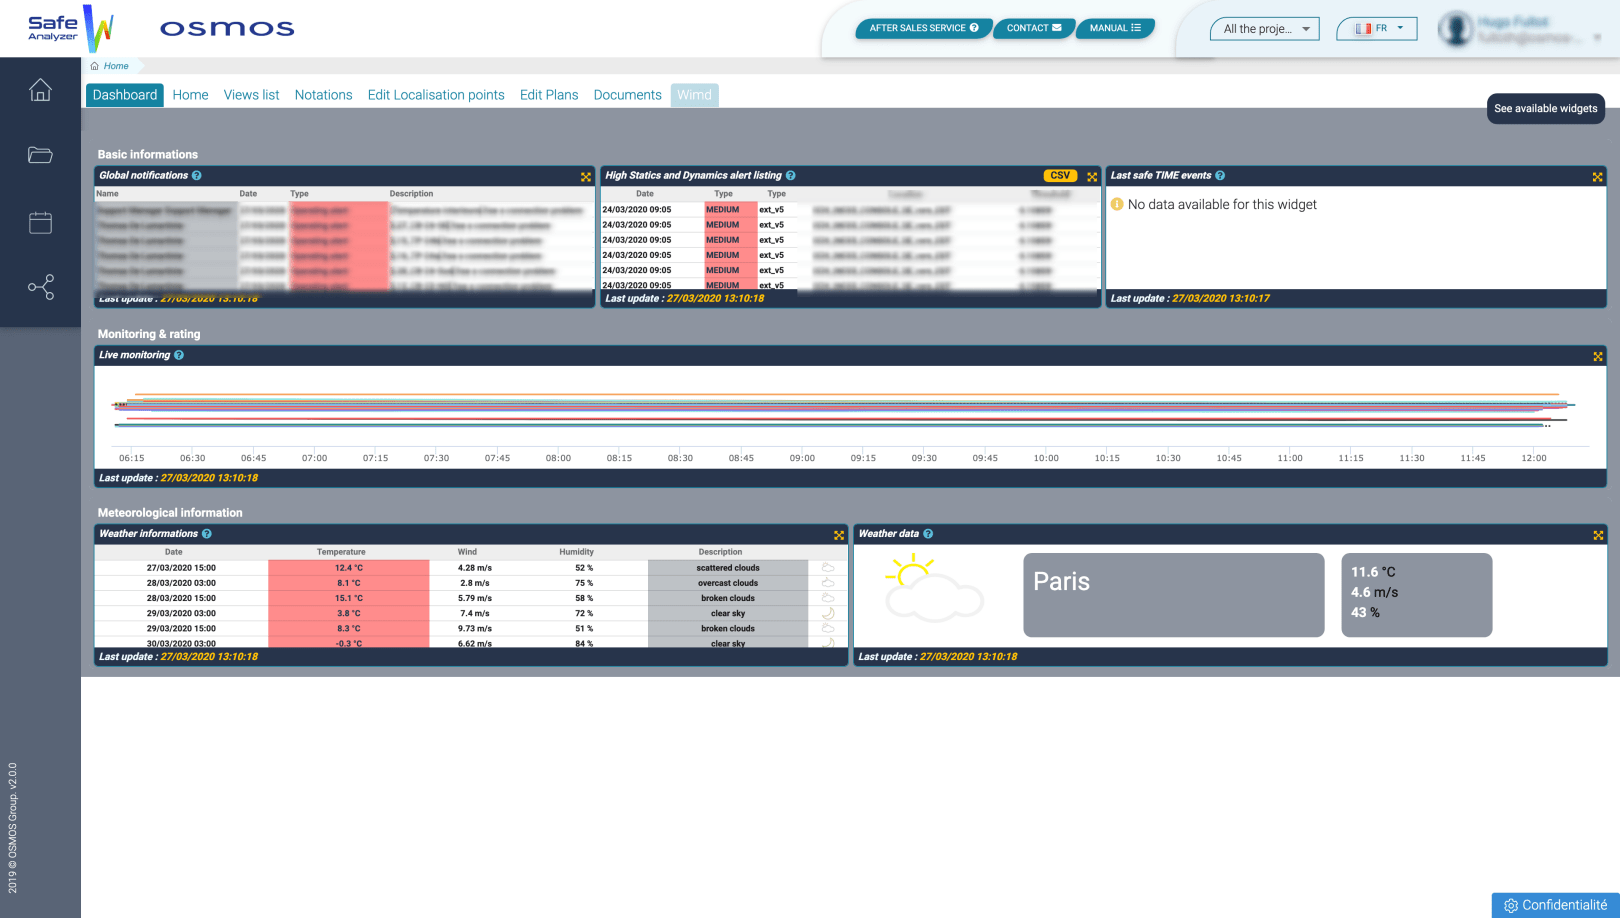
Dynamic events management

  • Display data in dynamic mode
  • Display of labels indicating the trigger of dynamic records
  • Easy visualization of dynamic signatures for each event
  • Comparison of an event over several sensors thanks to the multi-dynamic mode display

Events saving on SAFE Time

  • Event reporting from data
  • Attach a document to an event
  • Display reported events on SAFE Time
Reinvented weigh-in-motion with OSMOS SAFE WiM+D ®